探究 LightHouse 工作流程
什么是 Lighthouse
Lighthouse analyzes web apps and web pages, collecting modern performance metrics and insights on developer best practices.
使用方式
- Chrome 浏览器插件。Chrome 插件的形式提供了更加友好的用户界面,方便读取报告。
- Chrome DevTools。该工具集成在最新版本的 Chrome 浏览器中,无需安装即可使用。
- Lighthouse CLI 命令行工具。方便将 Lighthouse 集成到持续集成系统中。
- 代码中引用。我们也能通过 Node.js 模块引入 Lighthouse 工具包。
原理结构[1]
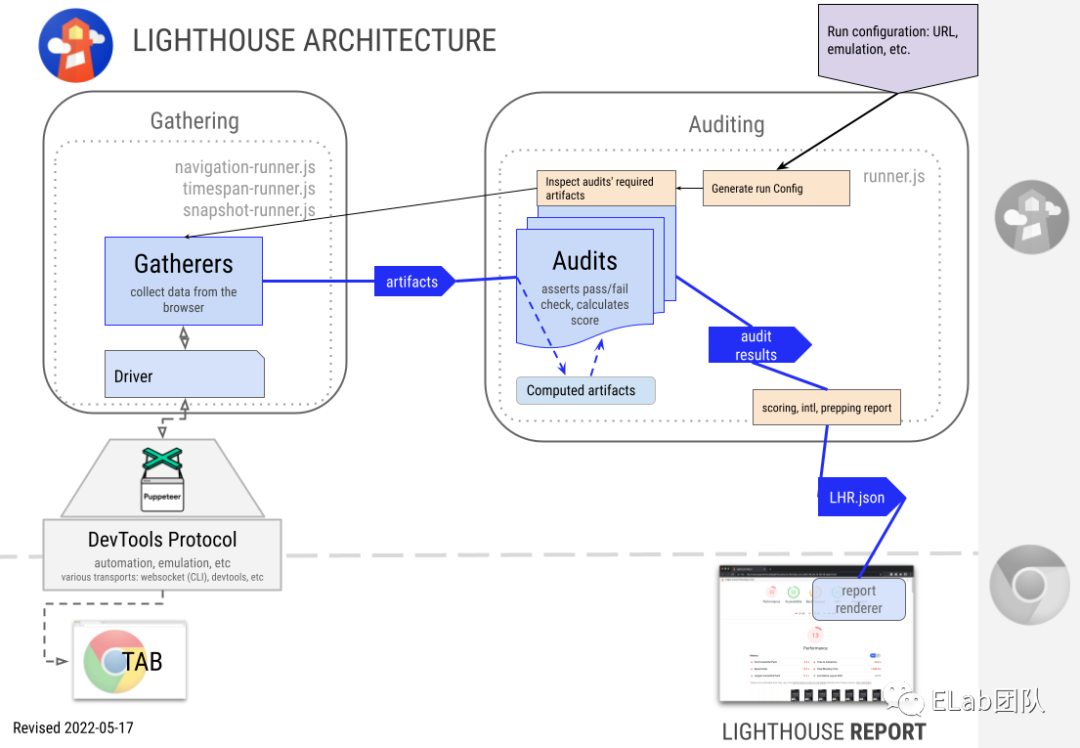

Gathering
Driver 驱动
通过 Chrome Debugging Protocol 和 Puppeteer[2] (提供无头浏览器环境模拟页面操作) /进行交互。
Chrome Debugging Protocol(CDP)
Chrome DevTools 协议允许使用工具来检测、检查、调试和分析 Chromium、Chrome 和其他基于 Blink 的浏览器。 在Chrome扩展中,Chrome protocol 利用 chrome.debugger Api 通过 WebSocket[3] 来建立连接。
Instrumentation 分为多个 Domains(DOM, Debugger, Network 等)。每个 Domain 定义了许多它支持的命令和它生成的事件。命令和事件都是固定结构的序列化 JSON 对象。
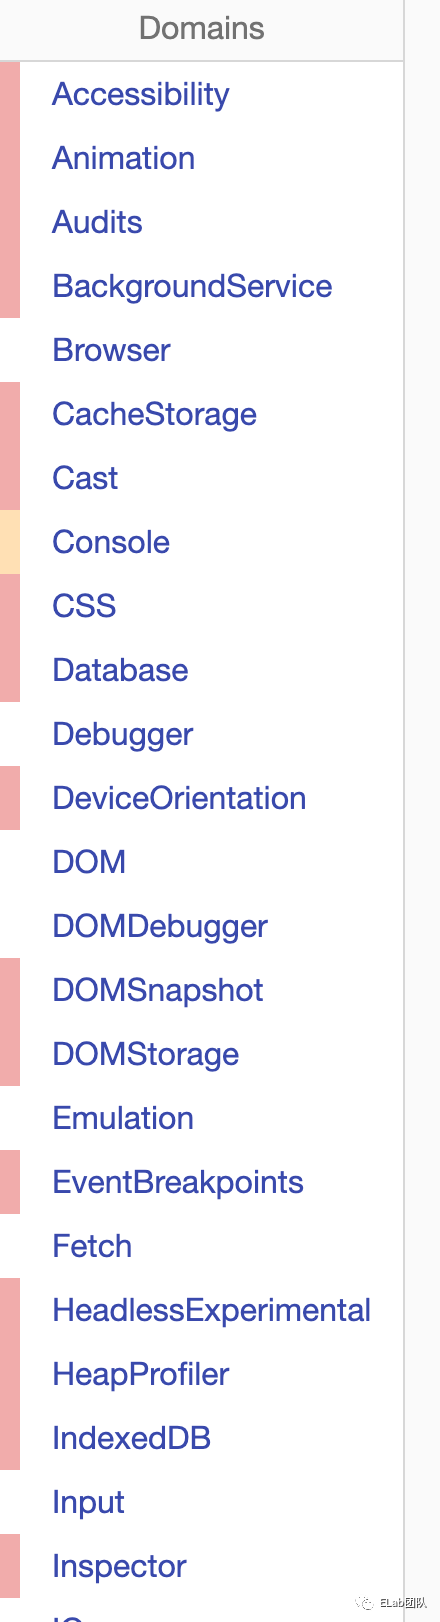
Domain 必须 enable() 后才可以发出事件。一旦启用enable,它们将刷新表示状态的所有事件。因此,网络事件仅在 enable() 后才会发出。所有协议代理解析 enable() 的回调。比如:
// will NOT work
driver.defaultSession.sendCommand('Security.enable').then(_ => {
  driver.defaultSession.on('Security.securityStateChanged', state => { /* ... */ });
})

// WILL work! happy happy. :)
driver.defaultSession.on('Security.securityStateChanged', state => { /* ... */ }); // event binding is synchronous
driver.defaultSession.sendCommand('Security.enable');- 调试协议:阅读更好地调试协议 Better debugging of the Protocol[4]。
配置
passes
passes 属性控制如何加载请求的 URL,以及在加载时收集哪些关于页面的信息。pass 数组中的每个条目代表页面的一次加载,
每个 pass 都定义了基本设置,例如等待页面加载多长时间、是否记录 trace 文件。此外,每次传递都定义了要使用的 gatherer 列表。gatherer 可以从页面中读取信息以生成 artifacts,稍后 Audits 使用这些artifacts提供 Lighthouse 报告。
具体的 pass 配置示例:
{
    passes: [{
        passName: 'fastPass',
        atherers: ['fast-gatherer'],
    },
    {
        passName: 'slowPass',
        recordTrace: true,
        useThrottling: true,
        networkQuietThresholdMs: 5000,
        gatherers: ['slow-gatherer'],
     }]
 }
Gatherers 采集器
决定在页面加载过程中采集哪些信息,将采集的信息输出为 artifacts。使用 Driver 采集页面信息。用 --gather-mode 指令运行可以获得3个采集产物:
1 . artifacts.json: 所有采集器的输出。
2 . defaultPass.trace.json: 大多数性能指标。可以在DevTools性能面板中查看。
3 . defaultPass.devtoolslog.json: DevTools Protocol[5] 事件的日志。
每一个 gatherer继承自相同的基类 Gatherer,基类 Gatherer定义了传递生命周期的n个方法。 gatherer的artifacts是生命周期方法返回的最后一个未定义值,所有方法都可以直接返回artifacts或返回解析为该值的 Promise。子类只需实现生命周期方法即可。
比如用于js覆盖率的 gatherer:
该实例实现了 startInstrumentation 、stopInstrumentation、getArtifact 3个生命周期方法,其
class JsUsage extends FRGatherer {
  meta = {
    supportedModes: ['snapshot', 'timespan', 'navigation'],
  };

  constructor() {
    super();
    this._scriptUsages = [];
  }
  async startInstrumentation(context) {
    const session = context.driver.defaultSession;
    await session.sendCommand('Profiler.enable');
    await session.sendCommand('Profiler.startPreciseCoverage', {detailed: false});
  }


  async stopInstrumentation(context) {
    const session = context.driver.defaultSession;
    const coverageResponse = await session.sendCommand('Profiler.takePreciseCoverage');
    this._scriptUsages = coverageResponse.result;
    await session.sendCommand('Profiler.stopPreciseCoverage');
    await session.sendCommand('Profiler.disable');
  }

  async getArtifact() {
    const usageByScriptId = {};
    for (const scriptUsage of this._scriptUsages) {
      if (scriptUsage.url === '' || scriptUsage.url === '_lighthouse-eval.js') {
        continue;
      }
      usageByScriptId[scriptUsage.scriptId] = scriptUsage;
    }
    return usageByScriptId;
  }
}

class  FRGatherer { meta = { supportedModes : []};    //在任意时间段内开始观察页面   startInstrumentation ( passContext ) { }  //Sensitive开始观察页面   startSensitiveInstrumentation ( passContext ) { }  //Sensitive停止观察页面的方法   stopSensitiveInstrumentation ( passContext ) { }  //在任意时间段内结束观察页面   stopInstrumentation ( passContext ) { }   //收集有关页面的结果   getArtifact ( passContext ) { }   /** * Legacy  */   get name () {}   async beforePass ( passContext ) {}   pass ( passContext ) { }   async afterPass ( passContext, loadData ) {}
当 pass 中定义的所有 gatherers 运行完后,就会生成一个中间产物 artifacts,此后 Lighthouse 就可以断开与浏览器的连接,只使用 artifacts 进行后续的分析。
Trace 链路追踪
core/lib/tracehouse/trace-processor.js提供了链路到更有意义对象的转换。每个原始trace event[6] 都具有以微秒为单位增长的时间戳、线程ID、进程ID、持续时间以及其他适用的元数据属性(比如事件类型、任务名称、帧等)
Example Trace Event
{
    'pid': 41904, // process ID
    'tid': 1295, // thread ID
    'ts': 1676836141, // timestamp in microseconds
    'ph': 'X', // trace event type
    'cat': 'toplevel', // trace category from which this event came
    'name': 'MessageLoop::RunTask', // relatively human-readable description of the trace event
    'dur': 64, // duration of the task in microseconds
    'args': {}, // contains additional data such as frame when applicable
}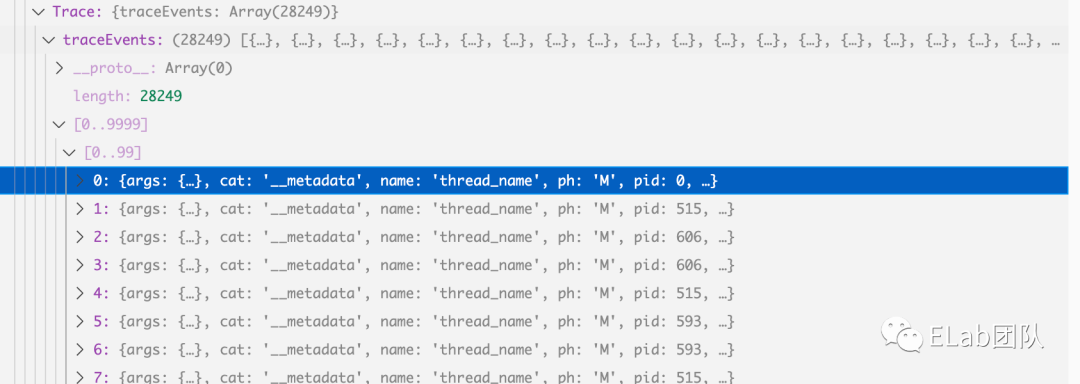
Processed trace
Processed trace 可识别关键时刻的 trace 事件((navigation start, FCP, LCP, DCL, trace end 等),并过滤出主进程和主线程事件的视图。
{
    processEvents: [/* all trace events in the main process */],
    mainThreadEvents: [/* all trace events on the main thread */],
    timings: {
        timeOrigin: 0, // timeOrigin is always 0
        msfirstContentfulPaint: 150, // firstContentfulPaint time in ms after time origin
        /* other key moments */
        traceEnd: 16420, // traceEnd time in ms after time origin
     },
     timestamps: {
         timeOrigin: 623000000, // timeOrigin timestamp in microseconds, marks the start of the navigation of interest
         firstContentfulPaint: 623150000, // firstContentfulPaint timestamp in microseconds
         /* other key moments */
         traceEnd: 639420000, // traceEnd timestamp in microseconds
     },
 }
实现
1 . Connecting to browser
2 . Resetting state with about:blank
3 . Navigate to about:blank
4 . Benchmarking machine
5 . Initializing…
6 . Preparing target for navigation mode
7 . Running defaultPass pass
8 . Resetting state with about:blank
9 . Navigate to about:blank
10 . Preparing target for navigation
11 . Cleaning origin data
12 . Cleaning browser cache
13 . Preparing network conditions
14 . Beginning devtoolsLog and trace
15 . Loading page & waiting for onload
16 . Navigating to https:XXX
17 . Gathering in-page: XXXXXXXX. (xN)
18 . Gathering trace
19 . Gathering devtoolsLog & network records
20 . Gathering XXX (xN)
begin();
  |
   → runLighthouse();
           |
            →  legacyNavigation();


async function legacyNavigation(url, flags = {}, configJSON, userConnection) {
    //...
  const connection = userConnection || new CriConnection(flags.port, flags.hostname);
  const artifacts = await Runner.gather(() => {
    const requestedUrl = UrlUtils.normalizeUrl(url);
    return Runner._gatherArtifactsFromBrowser(requestedUrl, options, connection);
  }, options);
  return Runner.audit(artifacts, options);
}

static async _gatherArtifactsFromBrowser(requestedUrl, runnerOpts, connection) {
   //创建connection的Driver
    const driver = runnerOpts.driverMock || new Driver(connection);
    const gatherOpts = {
      driver,
      requestedUrl,
      settings: runnerOpts.config.settings,
      computedCache: runnerOpts.computedCache,
    };
    const artifacts = await GatherRunner.run(runnerOpts.config.passes, gatherOpts);
    return artifacts;
  }
 /****** GatherRunner ****/
static async run(passConfigs, options) {


 //1.Connecting to browser
          //通过 Websocket 建立连接, 基于 Chrome Debugging Protocol 通信
         // CDPSession 实例用于与 Chrome Devtools 协议的原生通信
      await driver.connect();
        // 在 devtools/extension 案例中,我们在尝试清除状态时仍不能在站点上
 // 所以我们首先导航到 about:blank,然后应用我们的仿真和设置
       // 2.Resetting state with about:blank  & 3.Navigating to blankPage
      await GatherRunner.loadBlank(driver);
     // 4. Benchmarking machine
      const baseArtifacts = await GatherRunner.initializeBaseArtifacts(options);

      // ...processing benchmarkIndex

         // 5. Initializing…
      await GatherRunner.setupDriver(driver, options);

      let isFirstPass = true;
      // each pass
      for (const passConfig of passConfigs) {
        const passContext = {
          gatherMode: 'navigation',
          driver,
          url: options.requestedUrl,
          settings: options.settings,
          passConfig,
          baseArtifacts,
          computedCache: options.computedCache,
          LighthouseRunWarnings: baseArtifacts.LighthouseRunWarnings,
        };
 //Starting from about:blank, load the page and run gatherers for this pass.
        const passResults = await GatherRunner.runPass(passContext);
        Object.assign(artifacts, passResults.artifacts);

        // If we encountered a pageLoadError, don't try to keep loading the page in future passes.
        if (passResults.pageLoadError && passConfig.loadFailureMode === 'fatal') {
          baseArtifacts.PageLoadError = passResults.pageLoadError;
          break;
        }

        if (isFirstPass) {
          await GatherRunner.populateBaseArtifacts(passContext);
          isFirstPass = false;
        }
      }

      await GatherRunner.disposeDriver(driver, options);
      return finalizeArtifacts(baseArtifacts, artifacts);
    } catch (err) {
      // Clean up on error. Don't await so that the root error, not a disposal error, is shown.
      GatherRunner.disposeDriver(driver, options);

      throw err;
    }
}

  _connectToSocket(response) {
    const url = response.webSocketDebuggerUrl;
    this._pageId = response.id;

    return new Promise((resolve, reject) => {
      const ws = new WebSocket(url, {
        perMessageDeflate: false,
      });
      ws.on('open', () => {
        this._ws = ws;
        resolve();
      });
      ws.on('message', data => this.handleRawMessage(/** @type {string} */ (data)));
      ws.on('close', this.dispose.bind(this));
      ws.on('error', reject);
    });
  }


   static async setupDriver(driver, options) {
    //...
    await GatherRunner.assertNoSameOriginServiceWorkerClients(session, options.requestedUrl);
 // 6. Preparing target for navigation mode,通过为全局 API 或错误处理启用协议域、仿真和新文档处理程序,准备在导航模式下分析的目标。
    await prepare.prepareTargetForNavigationMode(driver, options.settings);
  }

  static async runPass(passContext) {
   //7. Running defaultPass pass

    const gathererResults = {};
    const {driver, passConfig} = passContext;

    // 8.Resetting state with about:blank 9.Navigating to about:blankGo to about:blank
 // set up

    await GatherRunner.loadBlank(driver, passConfig.blankPage);
 // 10.Preparing target for navigation ~ 13.Preparing network conditions
    const {warnings} = await prepare.prepareTargetForIndividualNavigation(
      driver.defaultSession,
      passContext.settings,
      {
        requestor: passContext.url,
        disableStorageReset: !passConfig.useThrottling,
        disableThrottling: !passConfig.useThrottling,
        blockedUrlPatterns: passConfig.blockedUrlPatterns,
      }
    );
    // run `startInstrumentation() /beforePass()` on gatherers.
    passContext.LighthouseRunWarnings.push(...warnings);
    await GatherRunner.beforePass(passContext, gathererResults);

    // 14.Beginning devtoolsLog and trace,
    //    await driver.beginDevtoolsLog(); await driver.beginTrace(settings);
    await GatherRunner.beginRecording(passContext);
     //15.Loading page & waiting for onload ,16.Navigating to https:XXX
    const {navigationError: possibleNavError} = await GatherRunner.loadPage(driver, passContext);
     //17.Gathering in-page: XXXXXXXX,run `pass()` on gatherers.
    await GatherRunner.pass(passContext, gathererResults);
    const loadData = await GatherRunner.endRecording(passContext);

     //18.Gathering trace 19.Gathering devtoolsLog & network records
    await emulation.clearThrottling(driver.defaultSession);

        //process page error

    // If no error, save devtoolsLog and trace.
    GatherRunner._addLoadDataToBaseArtifacts(passContext, loadData, passConfig.passName);

     //  20.Gathering XXX.  Run `afterPass()(stopInstrumentation -> getArtifact )` on gatherers and return collected artifacts.
    await GatherRunner.afterPass(passContext, loadData, gathererResults);
    const artifacts = GatherRunner.collectArtifacts(gathererResults);


    return artifacts;
  }
Auditing
Audits 审查器
- Audits是对单个功能/优化/指标的测试,Gatherer 采集的 artifacts 作为输入,审查器会对其测试,然后得出相应的测评分数结果。
- Computed Artifacts :根据 artifacts 的需求生成,有额外的含义,经常在在多个 audits 中共享。
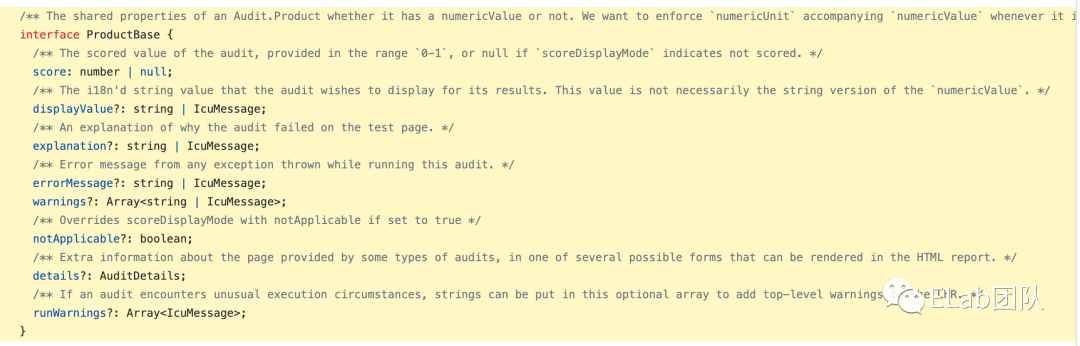
- 测评结果结构:
配置
-
audits
- audits 属性控制要运行和包含在 Lighthouse 报告中的审计。 查看更多示例以了解如何将自定义审核添加到您的配置中。
- 具体的 audits 配置示例:
{
    audits: [
        'first-contentful-paint',
        'byte-efficiency/uses-optimized-images',
    ]
}
实现
1 . Analyzing and running audits
2 . Auditing: XXX
3 . Generating results...
  async function legacyNavigation(url, flags = {}, configJSON, userConnection) {
    //...
  return Runner.audit(artifacts, options);
}
  static async audit(artifacts, options) {

        //...
       //1. Analyzing and running audits &2.Auditing: XXX
      const auditResultsById = await Runner._runAudits(settings, config.audits, artifacts,
          lighthouseRunWarnings, computedCache);

   //3.Generating results...
      if (artifacts.LighthouseRunWarnings) {
        lighthouseRunWarnings.push(...artifacts.LighthouseRunWarnings);
      }

      //....

  }
Report 报告
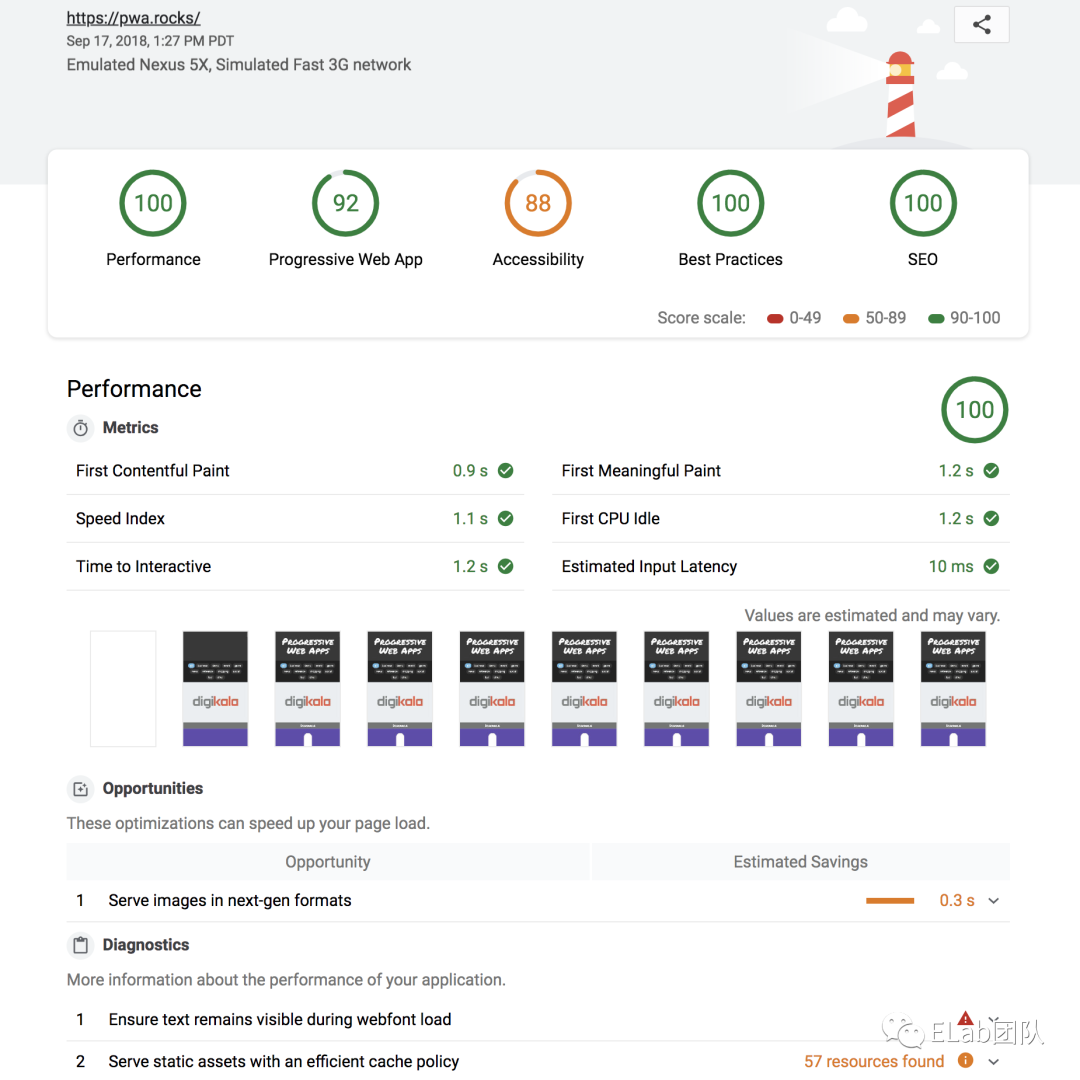
客户端根据生成 Audit 结果的 LHR.json (Lighthouse Result) 生成结果报告页。评分报告,它包含了性能(Performance),访问无障碍(Accessibility),最佳实践(Best Practice),搜索引擎优化(SEO),PWA(Progressive Web App)5 个部分,每一项下面又有若干小项(audit),还有详细诊断结果和优化建议,帮助开发者有针对性地进行优化。
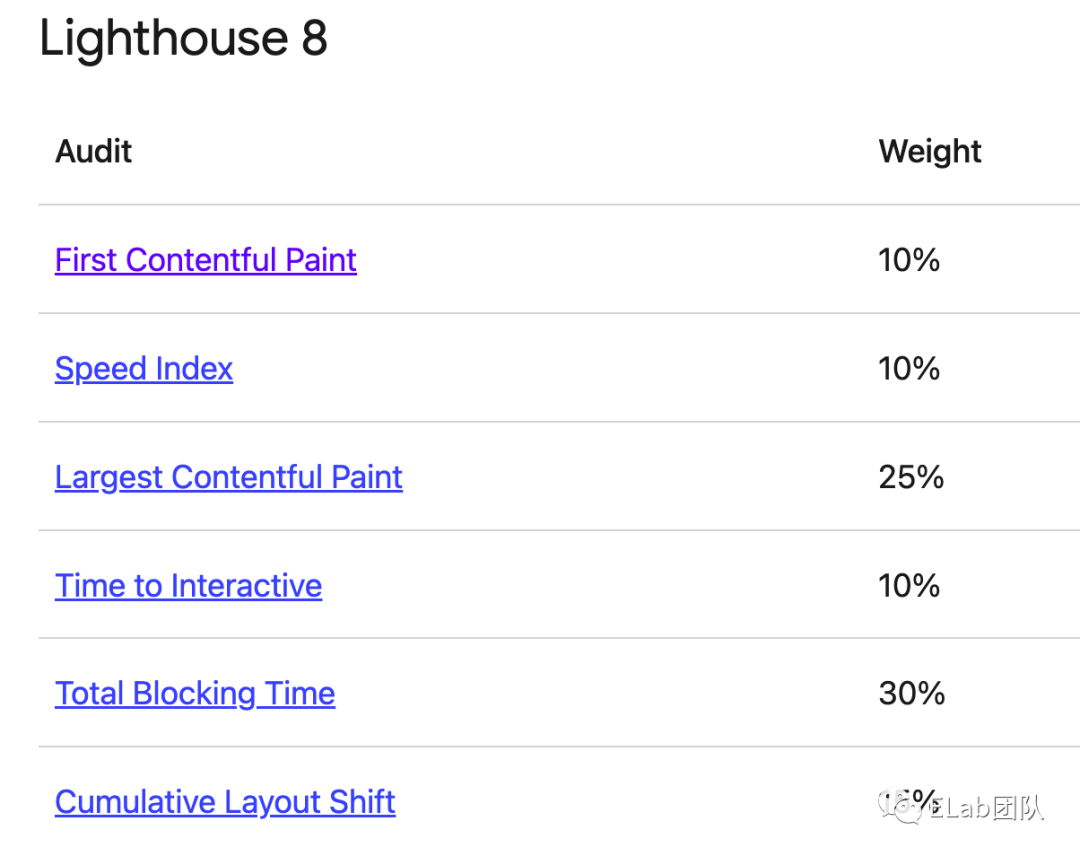
例如:在 Lighthouse 8 中,性能得分由以下几项的得分按不同的权重相加而得:
如何确定指标分数
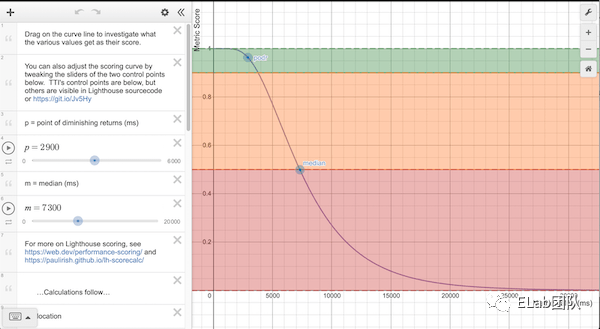
以性能评分[7]为例,一旦 Lighthouse 收集完性能指标(主要以毫秒为单位报告),它会通过查看指标值在其 Lighthouse 评分分布中的位置,将每个原始指标值转换为从 0 到 100 的指标分数。评分分布是从 HTTP Archive[8] 上真实网站性能数据的性能指标得出的对数正态分布。
Lighthouse 评分曲线模型使用 HTTPArchive 数据来确定两个控制点,然后设置对数正态曲线的形状。HTTPArchive 数据的第 25 个百分位数变为 50 分(中值控制点),第 8 个百分位数变为 90 分(良好/绿色控制点)。在探索下面的评分曲线图时,请注意在 0.50 和 0.92 之间,度量值和分数之间存在近乎线性的关系。0.96 左右的分数是上面的“收益递减点”,曲线拉开,需要越来越多的指标改进来提高已经很高的分数。
指标得分和性能得分根据以下范围进行着色:
0至49(红色):差
50至89(橙色):需要改进
90至100(绿色):良好
为了提供良好的用户体验,网站应该努力获得良好的分数(90-100)。
实现
static async audit(artifacts, options) {

  //....
  //conclusion of the lighthouse result object
  const axeVersion = artifacts.Accessibility?.version;
      const credits = {
        'axe-core': axeVersion,
      }
      let categories = {};
      if (config.categories) {
        categories = ReportScoring.scoreAllCategories(config.categories, auditResultsById);
      }
      // Replace ICU message references with localized strings; save replaced paths in lhr.
      i18nLhr.i18n.icuMessagePaths = format.replaceIcuMessages(i18nLhr, settings.locale);
      // LHR has now been localized.
      const lhr = /** @type {LH.Result} */ (i18nLhr);
      if (settings.auditMode) {
        const path = Runner._getDataSavePath(settings);
        assetSaver.saveLhr(lhr, path);
      }
      // 生成报告
      const report = ReportGenerator.generateReport(lhr, settings.output);
      return {lhr, artifacts, report};
}
参考资料
[1]原理结构: https://github.com/GoogleChrome/lighthouse/blob/main/docs/architecture.md
[2]Puppeteer: https://github.com/puppeteer/puppeteer
[3]WebSocket: https://github.com/websockets/ws
[4]Better debugging of the Protocol: https://github.com/GoogleChrome/lighthouse/issues/184
[5]DevTools Protocol: https://chromedevtools.github.io/devtools-protocol/
[6]trace event: https://docs.google.com/document/d/1CvAClvFfyA5R-PhYUmn5OOQtYMH4h6I0nSsKchNAySU/preview
[7]性能评分: https://web.dev/performance-scoring/
[8]HTTP Archive: https://httparchive.org/reports/state-of-the-web
[9]探索 TTI 的评分曲线: https://www.desmos.com/calculator/o98tbeyt1t
- END -