搭建简易画板(二)
一、 笔刷拓展
现在画板可以绘制图案并生成图片,我们来给线条增加一些花样,例如蜡笔。
第一种方案:自定义算法,即正常绘画的基础上,随机清除掉不定数量不定长宽的小矩形。
function draw(pathInfo, curCtx?: any) {
    let useCtx = curCtx ? curCtx : ctx;
    if (pathInfo.beginX !== null && pathInfo.beginY !== null) {
        const {lastX, lastY, beginX, beginY, strokeStyle, lineWidth, drawType} = pathInfo;
        useCtx.beginPath();
        useCtx.lineCap = 'round';
        useCtx.moveTo(beginX, beginY);
        useCtx.lineTo(lastX, lastY);
        useCtx.strokeStyle = strokeStyle;
        useCtx.lineWidth = lineWidth;
        // 增加粉笔
        if (drawType === "crayon") {
            var length = Math.round(Math.sqrt(Math.pow(lastX - beginX, 2) + Math.pow(lastY - beginY, 2)) / ( 5 / lineWidth));
            var xUnit = (lastX - beginX) / length;
            var yUnit = (lastY - beginY) / length;
            for(var i=0; i<length; i++ ) {
            var xCurrent = beginX + (i * xUnit);
            var yCurrent = beginY + (i * yUnit);
            var xRandom = xCurrent + (Math.random() - 0.5) * lineWidth * 1.2;
            var yRandom = yCurrent+(Math.random() - 0.5) * lineWidth * 1.2;
            useCtx.clearRect( xRandom, yRandom, Math.random() * 2 + 2, Math.random() + 1);
            }
        }
        useCtx.stroke();
        useCtx.closePath();
    }
}
第二种方案是直接用网上蜡笔的纹理图去叠加线条。如果使用其他域名的图片不要忘记给图片加上跨域 crayonImage.crossOrigin = '',不然再使用toDataURL等api的时候,浏览器会报画布污染错误。
let crayonImage = new Image();
crayonImage.src = "../images/crayon-bg.png";
crayonImage.onload = () => {
    callback(canvas)
};
function draw(pathInfo, curCtx?: any) {
    let useCtx = curCtx ? curCtx : ctx;
    if (pathInfo.beginX !== null && pathInfo.beginY !== null) {
    const {lastX, lastY, beginX, beginY, strokeStyle, lineWidth, drawType} = pathInfo;
    useCtx.beginPath();
    useCtx.lineCap = 'round';
    useCtx.moveTo(beginX, beginY);
    useCtx.lineTo(lastX, lastY);
    useCtx.strokeStyle = strokeStyle;
    useCtx.lineWidth = lineWidth;
    // 增加粉笔 先画一条用户选中的颜色线条,再加一条蜡笔图片的线条
    if (drawType === "crayon") {
        useCtx.stroke();
        useCtx.strokeStyle = useCtx.createPattern(crayonImage, 'repeat');
    }
    useCtx.stroke();
    useCtx.closePath();
    }
}
同理我们可以画出其他边框图形,大家可以自己试试,有其他方案也可以留言告诉我哈。
二、简易流程图
接下来我们实现一些比较有难度的功能,加一些简易流程图的绘制。
1. 添加矩形
添加矩形的api方式有几种
- rect(x,y,width,height) 仅是添加矩形,不会展示,需要再加上一句 ctx.stroke()才能展示
- strokeRect(x,y,width,height) 可以直接绘制矩形
- 也可以使用lineTo方法,根据四角坐标绘制四条线闭合成矩形
// 流程图绘制
function flowDraw(pathInfo, curCtx?: any) {
    let useCtx = curCtx ? curCtx : ctx;
    const {lastX, lastY, beginX, beginY, strokeStyle, lineWidth, drawType, flowType} = pathInfo;
    useCtx.beginPath();
    useCtx.strokeStyle = strokeStyle;
    useCtx.lineWidth = lineWidth;
    if (flowType === 'rect') {
        useCtx.rect(beginX, beginY, lastX - beginX, lastY - beginY);
    }
    useCtx.stroke();
    useCtx.closePath();
}
绘制矩形只需要监听鼠标按下和放开两个节点的坐标即可,在原监听方法下我们增加对绘制流程图的判断,以及在鼠标移开的时候直接调用流程图的绘制函数。
// flowLastPt 记录鼠标按下的节点
function handleMouseDown(event: any) {
    mouseButtonDown = true;
    lastPt = {
        x: event.pageX,
        y: event.pageY
    }
    if (config.flowType) {
        flowLastPt = {
            x: event.pageX,
            y: event.pageY
        }
    }
}
function handleMouseUp(event: any) {
    mouseButtonDown = false;
    lastPt = {x: null, y: null};
    if (config.flowType) {
        let flowPathData = {beginX: flowLastPt.x, beginY: flowLastPt.y, lastX: event.pageX, lastY: event.pageY, strokeStyle: config.strokeStyle, lineWidth: config.lineWidth, drawType: config.drawType, flowType: config.flowType};
        flowDraw(flowPathData)
        pathData.push(flowPathData)
        flowLastPt = {x: null, y: null};
    } else {
        pathData.push(singlePathData)
    }
    singlePathData = [];
    console.log(pathData, 'pathData')
}
由于图像绘制我们用一个数组去记录的当前线条的走向,流程只需要用对象记录下开始和结束的点就好,所以撤销函数也需要进行相应判断。
function undo() {
    pathData.pop();
    let canvasDom: any = document.getElementById('drawCanvas');
    let curCtx = canvasDom!.getContext('2d');
    let rect = canvasDom!.getBoundingClientRect();
    curCtx.clearRect(rect.x, rect.y, rect.width, rect.height);
    pathData.map(item => {
        // 当前对象是数组说明是线条绘画,否则是流程图的绘制
        if (Object.prototype.toString.call(item) === '[object Array]') {
            item.map(info => draw(info, curCtx))
        } else {
            flowDraw(item, curCtx)
        }
    })
}
看下效果,能够正常的展示矩形图,线条等设置,也能够正常的撤销,但是看起来怪怪的,因为不清楚自己的矩形在挪动的过程中到底画了多大,当前样式是什么,我们在移动过程中加上中间态的展示,思路是在body下增加一个dom节点,初始位置top是鼠标的left值,left值是鼠标的top值,然后宽高根据鼠标移动的位置进行绝对值计算,不要忘了将翻转原点设为top,left,当鼠标后续x位置比初始位置小,需要将图像沿y轴反转,y轴位置比初始位置小的时候沿x轴反转。
// 中间状态的绘制
function tempDomDraw(pathInfo) {
    const {lastX, lastY, beginX, beginY, strokeStyle, lineWidth, drawType, flowType} = pathInfo;
    if (flowType === 'rect') {
        tempDom.style.width = Math.abs(lastX - beginX) + 'px';
        tempDom.style.height = Math.abs(lastY - beginY) + 'px';
        tempDom.style.transform = `rotateX(${lastY < beginY ? '-180deg' : 0}) rotateY(${lastX < beginX ? '-180deg' : 0})`
        tempDom.style.border = `${lineWidth}px solid ${strokeStyle}`;
    }
}
function handleMouseDown(event: any) {
    mouseButtonDown = true;
    lastPt = {
        x: event.pageX,
        y: event.pageY
    }
    if (config.flowType) {
        flowLastPt = {
            x: event.pageX,
            y: event.pageY
        }
        tempDom = document.createElement("div");
        tempDom.id = "temp";
        tempDom.style.position = "absolute";
        tempDom.style.transformOrigin= 'left top';
        tempDom.style.top = event.pageY + 'px';
        tempDom.style.left = event.pageX + 'px';
        tempDom.style.boxSizing = 'border-box';
        tempDom.onclick = handleMouseUp; // 鼠标点击的时候经常会点击在新创建的dom节点上,出现粘粘现象,所以需要加上这个函数
        document.body.appendChild(tempDom);
    }
}
function handleMouseMove(event) {
    if (mouseButtonDown && !config.flowType) {
        let singleData = {beginX: lastPt.x, beginY: lastPt.y, lastX: event.pageX, lastY: event.pageY, strokeStyle: config.strokeStyle, lineWidth: config.lineWidth, drawType: config.drawType, flowType: config.flowType};
        singlePathData.push(singleData)
        draw(singleData)
        lastPt = {
            x: event.pageX,
            y: event.pageY
        }
    }
    if (mouseButtonDown && config.flowType) {
        let flowPathData = {beginX: flowLastPt.x, beginY: flowLastPt.y, lastX: event.pageX, lastY: event.pageY, strokeStyle: config.strokeStyle, lineWidth: config.lineWidth, drawType: config.drawType, flowType: config.flowType};
        tempDomDraw(flowPathData)
    }
}
2. 添加文字
同理我们可以在鼠标按下的时候创建input框,监听用户的输入,当回车或者失去焦点的时候保存input里的value值,笔刷里面的颜色和线条宽度同样可以作用到字体设置里。不要忘了把text数据存进数组里,这样撤回重新绘制也可以找到数据。
// flowDraw 函数里增加
if (flowType === 'fillText') {
    useCtx.font = lineWidth + 'px sans-serif';
    useCtx.fillStyle = strokeStyle;
    console.log(useCtx.font)
    useCtx.fillText(fillText, beginX, beginY)
}
// 初始化dom节点增加
if (config.flowType === 'fillText') {
    if (tempDom) return
    tempDom = document.createElement("input");
    tempDom.id = "temp";
    tempDom.style.position = "absolute";
    tempDom.style.top = event.pageY + 'px';
    tempDom.style.left = event.pageX + 'px';
    tempDom.onblur = (e) => {
        tempDom.setAttribute("inputValue", e.target.value)
    };
    document.body.appendChild(tempDom);
}
3. 绘制椭圆
椭圆的绘制api ctx.ellipse 目前只有谷歌支持,所以我们换个思路,先画一个圆,然后把这个圆横向压扁就是一个椭圆了。这里我们需要将画板进行保存然后再释放,因为在canvas设置scale属性会一直生效,需要将它回复原样,另外这里我们是先将路径绘制完成然后还原最后再上色,这样的椭圆是正常的椭圆形状,如果直接上色再进行还原,会发现线条也是被压缩的展示,中间细,两头粗。
if (flowType === 'elipse') {
    let radiusX = Math.abs(lastX - beginX);
    let radiusY = Math.abs(lastY - beginY);
    var r = radiusX > radiusY ? radiusX : radiusY; //用打的数为半径
    var scaleX = radiusX / r; //计算缩放的x轴比例
    var scaleY = radiusY / r; //计算缩放的y轴比例
    useCtx.save(); //保存副本
    useCtx.translate(beginX + radiusX / 2, beginY + radiusY / 2); //移动到圆心位置
    useCtx.scale(scaleX, scaleY); //进行缩放
    useCtx.arc(0, 0, r, 0, Math.PI * 2, Math.PI * 2); //绘制圆形
    useCtx.restore();
}
useCtx.stroke();
useCtx.closePath();
菱形的绘制也是同理,先画一个正方形,然后进行压缩。或者我们跟高端点,用下面绘制箭头的方法来绘制菱形。
4. 绘制箭头
箭头由三条线段组成,AB线条好画,主要在于C,D的坐标我们要如何计算呢。有两个方案,根据线段确定和根据夹角确定,下面的代码是根据夹角进行计算的。
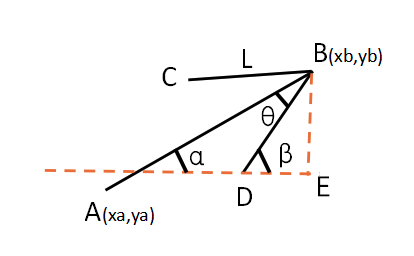
C的坐标xc = xb - L × cos(α-θ),yc = yd - L × sin(α-θ)。D的坐标xd = xb - L × cos(α+θ),yd = yd - L × sin(α+θ)。
if (flowType === 'arrow') {

    var l = 20; // 箭头L的长度

    var a = Math.atan2((lastY - beginY), (lastX - beginX));

    var x3 = lastX - l * Math.cos(a + 30 * Math.PI / 180);

    var y3 = lastY - l * Math.sin(a + 30 * Math.PI / 180);

    var x4 = lastX - l * Math.cos(a - 30 * Math.PI / 180);

    var y4 = lastY - l * Math.sin(a - 30 * Math.PI / 180);

    console.log(lastX, lastY, x3, y3, x4, y4, 'lastX, lastY, x3, y3, x4, y4')

    useCtx.moveTo(beginX, beginY);

    useCtx.lineTo(lastX, lastY);

    useCtx.moveTo(x3, y3);

    useCtx.lineTo(lastX, lastY);

    useCtx.lineTo(x4, y4);

}
画板的绘制到目前就告一段落了,我们从0到1实现了一个简易画板,了解了canvas相关知识点,一些形状的绘制方法,监听笔触并保存路径,最后可以生成并保存绘制后的png图片。接下来我们可以实现多人协作继续完善画板功能。
参考资料
在canvas中绘制箭头